cryspy-Eplot
Last updated: October 16, 2026
cryspy-Eplot Command
Starting from CrySPY version 1.4.1, the cryspy-Eplot command is installed.
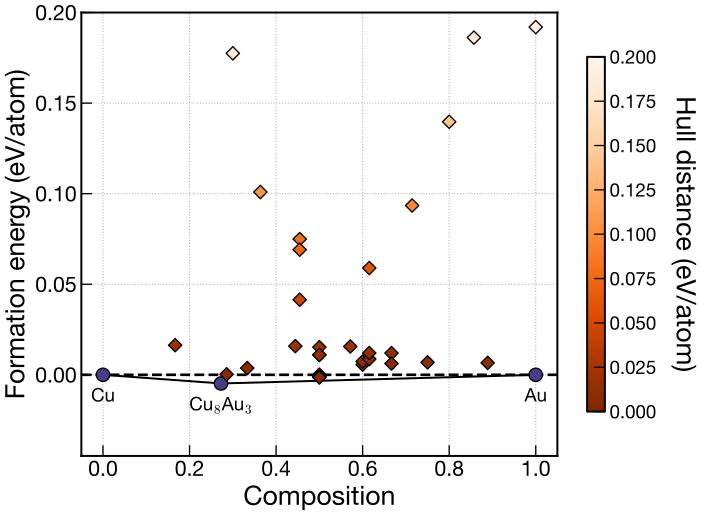
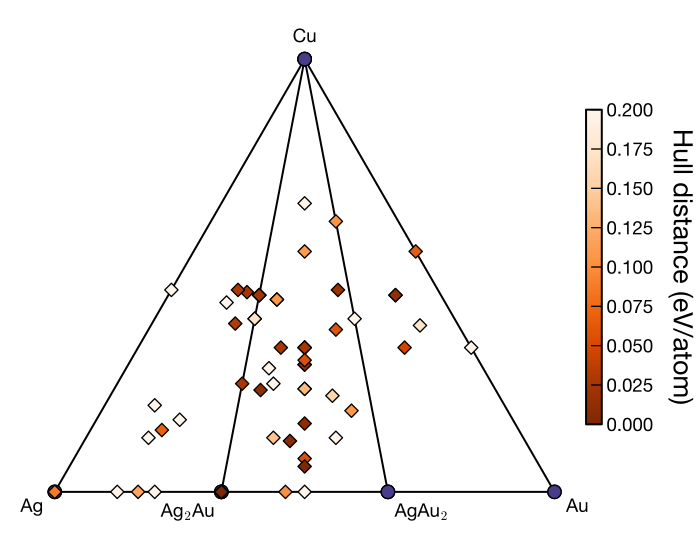
In EA-vc, a convex hull plot is automatically generated and saved at the end of each generation by default. Use energy_output_interval in the [option] section to change the output interval or disable automatic output (see Input File > [option] Section).
If you wish to modify the plotting parameters afterward, you can regenerate the plot using the cryspy-Eplot command.
For the input parameters that can be changed, see the following page.
Usage and Options
Run the following command in the directory containing cryspy.in.
| Option | Description |
|---|---|
-c, --composition-window | Save a plot of the composition range specified in cryspy.in. See Checking the Composition Range for details. |
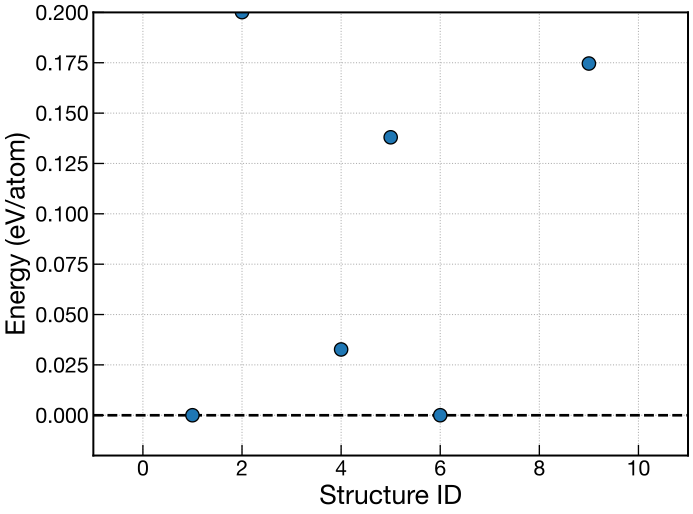
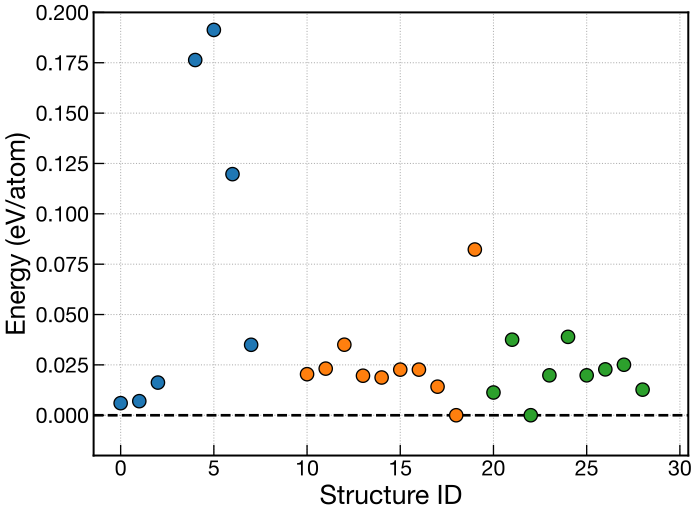
Energy Plots (RS, EA)
- CrySPY > Tutorial > Random Search (RS) > Analysis and Visualization
- CrySPY > Tutorial > Evolutionary Algorithm (EA) > Analysis and Visualization
Convex Hull Plots (EA-vc)
Standard Plots (Binary and Ternary Systems)
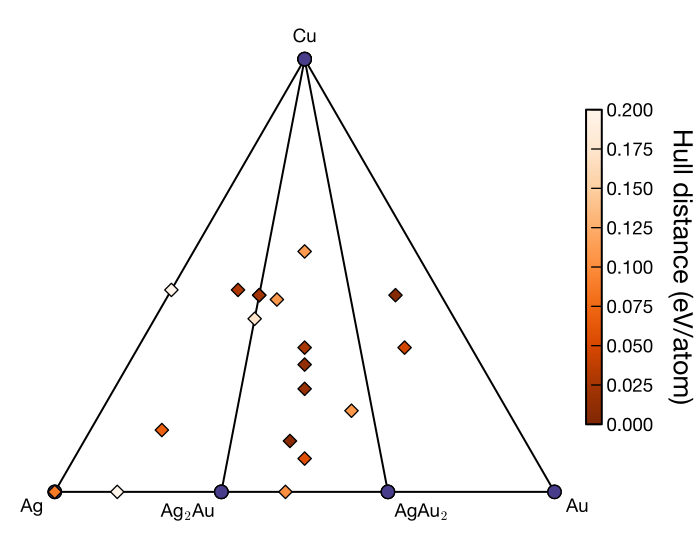
Replotting Specific Generations
An example using the convex hull from generation 3 and displaying structures from generation 2.
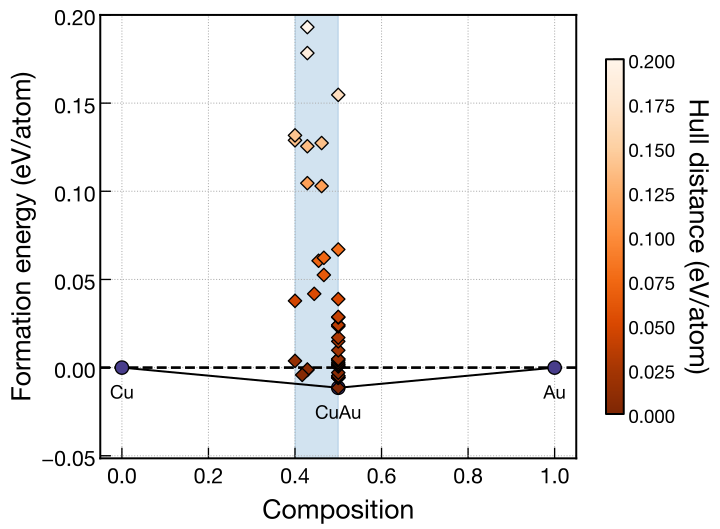
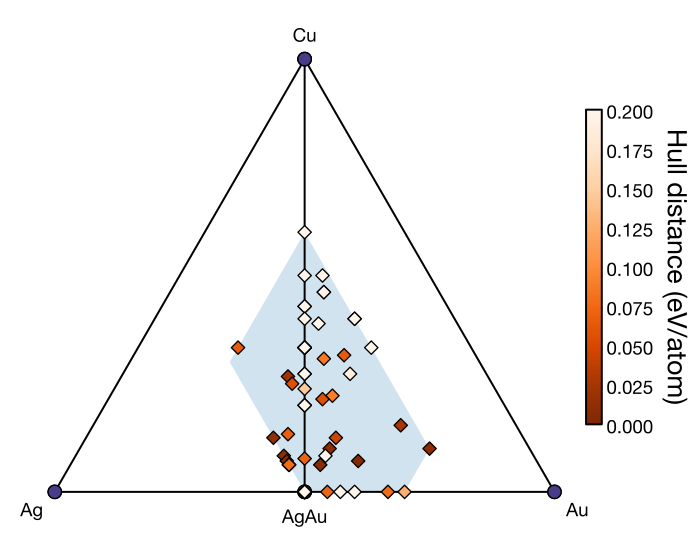
Plotting with Composition Constraints
Examples of binary and ternary plots with composition constraints. The blue region represents the allowed composition range.
Checking the Composition Range (-c)
From version 1.5.0, the allowed composition range can be plotted using the -c option when composition constraints are specified.
For EA-vc with min_comp or max_comp specified, the following command plots the allowed composition range defined in the current cryspy.in.
No search-result data is required, so the constraints can be checked before starting a search.
For standard binary and ternary systems, the plot is saved as ./data/convex_hull/composition_window_input.<fig_format>.
fig_format defaults to svg and can be changed to png or pdf in the [visual] section.
The species arrangement is specified by axis_order in the same section.
The input in the filename indicates that the plot is based on the input at execution time, independently of the generation number.
Examples for binary and ternary systems are shown below.
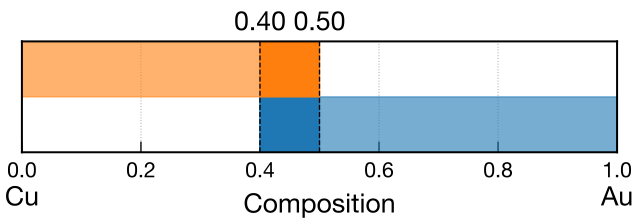
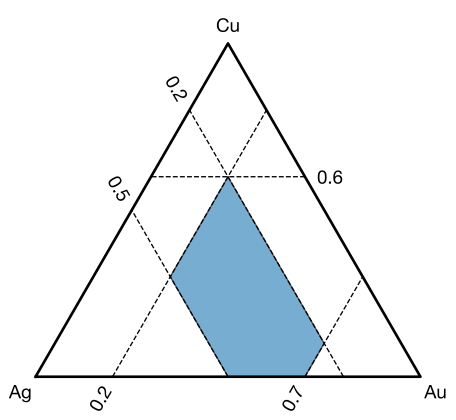
These plots represent the continuous composition region determined by min_comp and max_comp.
They do not account for integer atom-count constraints from ll_nat and ul_nat or charge neutrality from charge.
For input examples and an explanation of the plots, see Composition Constraints.
When -c is specified, the command outputs the composition-window plot and exits.
To replot the energy or convex hull of search results, run cryspy-Eplot without -c.
Changing Axis Arrangement
Change axis_order in the [visual] section of cryspy.in, then run cryspy-Eplot to redraw the plot with a different arrangement of species.
For details, see Tutorial > EA-vc > Analysis and Visualization and Input File > [visual] Section.
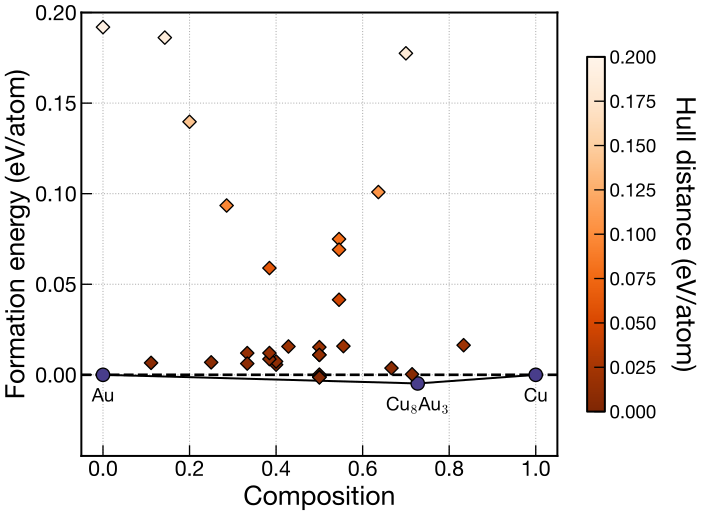
For binary systems, assign l (left) and r (right) in the order of atype.
The examples below use axis_order = lr (left) and axis_order = rl (right).
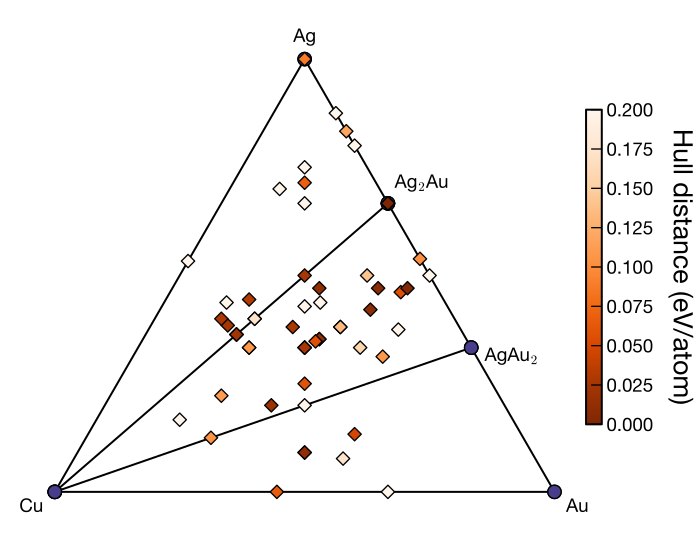
For ternary systems, assign t (top), l (left), and r (right) in the order of atype.
The examples below use axis_order = tlr (left) and axis_order = ltr (right).
Convex Hulls with Compound Terminals (terminals)
Specify two or three compound compositions with terminals in the [visual] section of cryspy.in to plot a convex hull using those compositions as references.
This uses pymatgen’s CompoundPhaseDiagram.
Depending on the reference compositions, a ternary system can also be plotted as a pseudo-ternary system, or a quaternary system as a pseudo-ternary system. Here, we show an example of plotting a ternary system as a pseudo-binary system.
This setting is for post-analysis with cryspy-Eplot and does not affect convex-hull calculations or natural selection during the search.
The following example uses a ternary Li–Al–O search through generation 30 with a charge neutrality condition imposed. The [structure] section is configured as follows.
Compositions satisfying this charge neutrality condition lie on the line connecting Li2O and Al2O3 in the ternary composition diagram. Using these compound compositions as references therefore allows the convex hull to be plotted as a pseudo-binary Li2O–Al2O3 system. See Features > Charge Neutrality Condition for details on imposing charge neutrality.
The left figure shows the ternary convex hull referenced to the elements; the right figure shows the pseudo-binary convex hull referenced to Li2O and Al2O3.
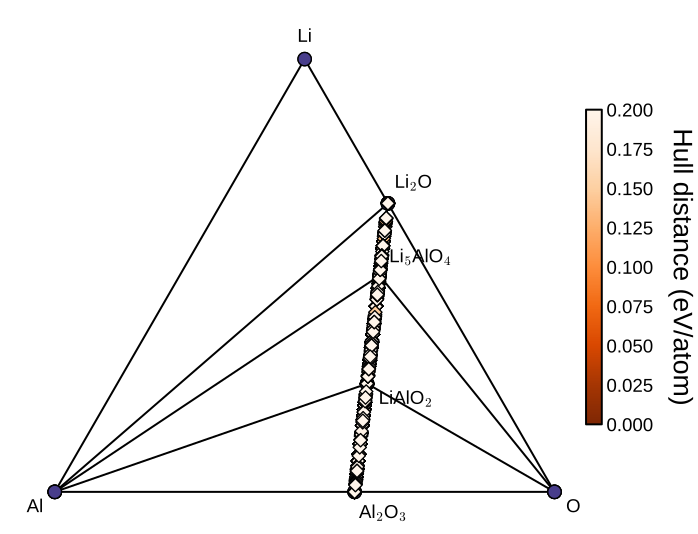
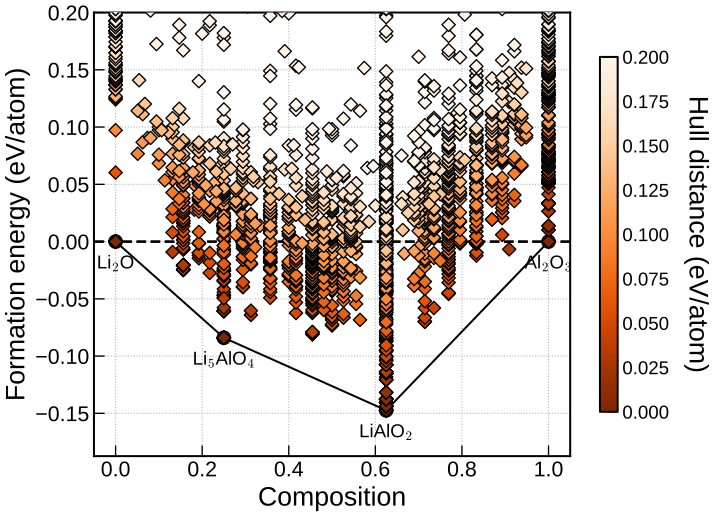
To obtain the right figure, configure the [visual] section as follows and run cryspy-Eplot.
The output filename includes _terminals_Li2O-Al2O3 to identify the reference compound compositions. In this example, the plot is saved in the default SVG format as ./data/convex_hull/conv_hull_gen_30_terminals_Li2O-Al2O3.svg.
With two compound compositions, omitting terminal_axis_order uses the default lr: Li2O is placed on the left and Al2O3 on the right, following the order in terminals.
Each specified compound composition must have an entry in the phase-diagram data used for plotting.
See Input File > [visual] Section for parameter details.