Energy Plot
Last updated: October 16, 2026
Automatic Energy Plot
In EA and in binary or ternary EA-vc searches, plots are automatically generated at the end of each generation by default.
| Algorithm | Plot | Output file |
|---|---|---|
| EA | Energy plot | ./data/energy_plot/energy_EA_gen_{gen}.{fig_format} |
| EA-vc (binary or ternary) | Convex hull plot | ./data/convex_hull/conv_hull_gen_{gen}.{fig_format} |
The left figure shows an EA energy plot, and the right figure shows an EA-vc convex hull plot. Both examples are from the end of generation 3.
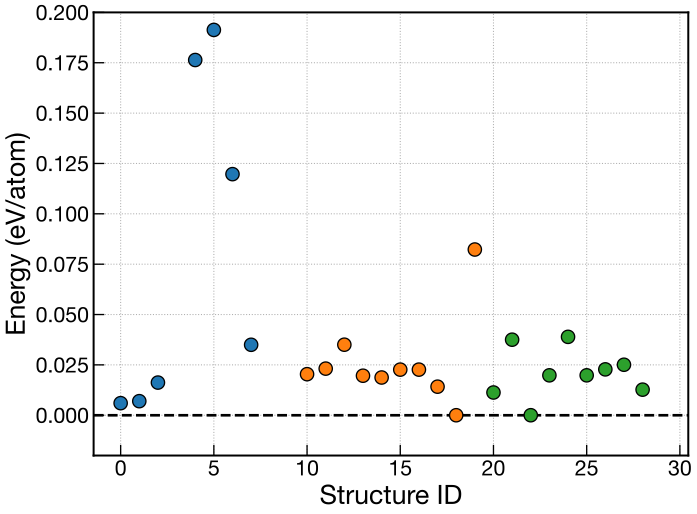
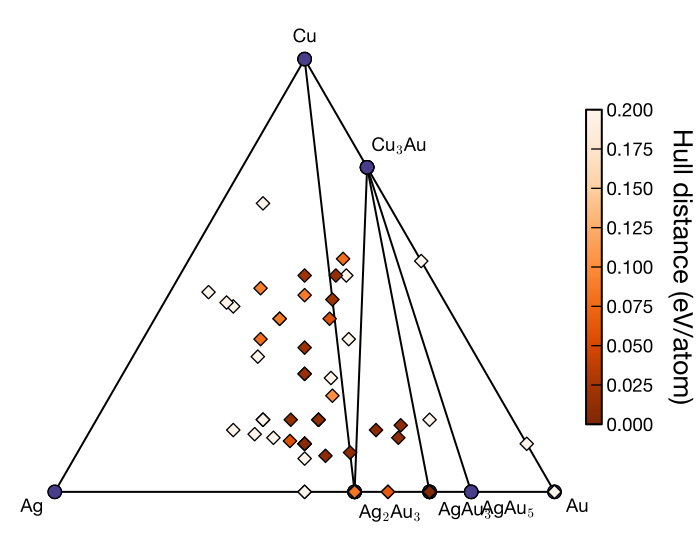
Here, gen is the generation number and fig_format is the image format (svg by default).
Plot appearance, including the marker size and image format, can be configured in the [visual] section of cryspy.in.
See Input File > [visual] Section for details.
For EA and EA-vc, the output interval can be changed with energy_output_interval in the [option] section.
The default value is 1 (every generation); 0 disables automatic output of the energy plot in EA and the convex-hull plot and hull-distance file in EA-vc.
The convex hull and hull distances in EA-vc are still calculated every generation.
See Input File > [option] Section.
For example plots and input settings, see Tutorial > EA > Analysis and Visualization and Tutorial > EA-vc > Analysis and Visualization.
cryspy-Eplot Command
The cryspy-Eplot command visualizes search results and adjusts plots. Its main capabilities are:
- Plot energies for RS/EA and convex hulls for EA-vc.
- Replot with changes to marker size, axis limits and arrangement, image format, and other display settings.
- Specify the generation range to plot and the reference generation in EA/EA-vc.
- Plot the allowed region defined by composition constraints.
- Specify reference compound compositions to plot convex hulls as pseudo-binary or pseudo-ternary systems.
For usage and examples, see Commands > cryspy-Eplot.