Check Results
Last updated: October 16, 2026
This section focuses on the differences from the EA method.
cryspy_rslt
Below is an example of a cryspy_rslt file after completing calculations up to the third generation.
In EA-vc, formation energy (Ef_eV_atom) and number of atoms (Num_atom) are also included.
From v1.5.0, rslt_out in the [option] section controls when cryspy_rslt and cryspy_rslt_energy_asc are written. The default is always. See Input File > [option] Section for details.
Checking Results for a Specific Composition
From v1.5.0, the -c (--composition) option of cryspy-print displays only results with a specified composition ratio from rslt_data.pkl.
Specify the ratio in atype order. In this example, atype = Cu Ag Au, so the following command selects structures with no Cu and an Ag:Au ratio of 1:1.
Ratios are reduced before comparison, so IDs 7 and 8 in the table above, with Num_atom values of (0, 4, 4) and (0, 3, 3), both match.
Matching results are displayed in ascending order of formation energy (Ef_eV_atom). --all displays all matching rows; replace it with --head 10 to display only the ten lowest-energy results.
Output for the data in the table above:
nat_data
Information on the number of atoms and composition is also included in nat_data.
hull_dist_all_gen_x
With the default settings, for example, after the third generation is completed, the hull distance data is output to the file ./data/convex_hull/hull_dist_all_gen_3.
The output interval is set with energy_output_interval in the [option] section. The default is 1 (every generation); 0 disables automatic file output. See Input File > [option] Section for details.
conv_hull_gen_x.svg
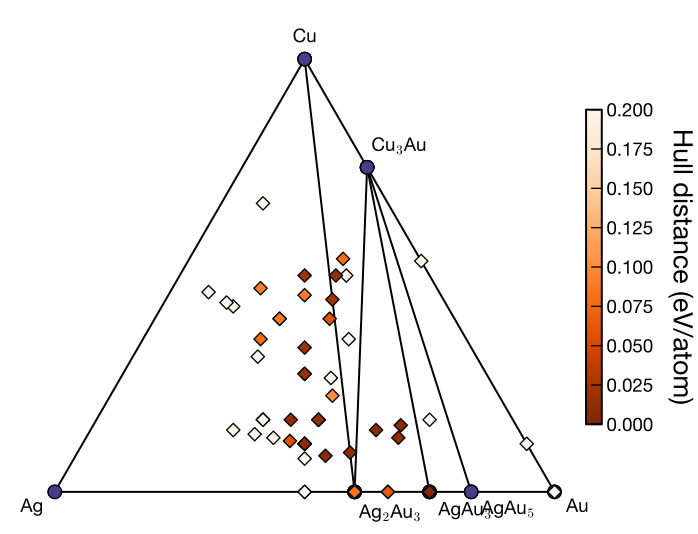
With the default settings, the convex hull plot at the end of generation 3 is saved as ./data/convex_hull/conv_hull_gen_3.svg.
Automatic output of the convex hull plot follows the same energy_output_interval setting.
Although svg is the default format, it can be changed to pdf or png by modifying the fig_format in the input file.