Analysis and Visualization
Last updated: October 16, 2026
Automatic Energy Plotting
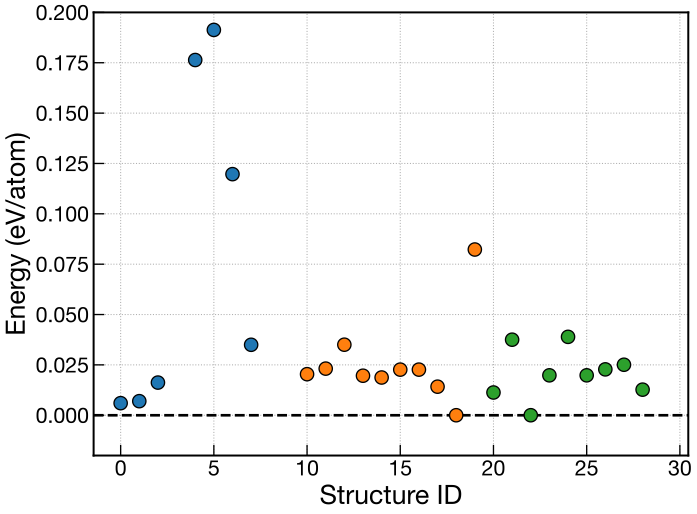
Since version 1.4.4, the energy plot is automatically generated after each generation finishes by default.
The figure is saved to ./data/energy_plot/energy_EA_gen_{gen}.{fig_fotmat}.
From version 1.5.0, the output interval in generations can be changed with energy_output_interval in the [option] section. The default is 1 (every generation); 0 disables automatic output. See Input File > [option] Section for details.
The following input variables can be set in the [visual] section of cryspy.in.
See also CrySPY > Input file > [visual] section.
Replotting with cryspy-Eplot
If you want to fine-tune the figure and replot it, you can easily do so using the cryspy-Eplot command as follows:
When using the cryspy-Eplot command, the following variables can also be specified in the [visual] section in addition to the standard variables above.
plot_min_genplot_max_genref_gen
For example, to replot the figure at generation 2, write the [visual] section as follows:
Then, run the following command:
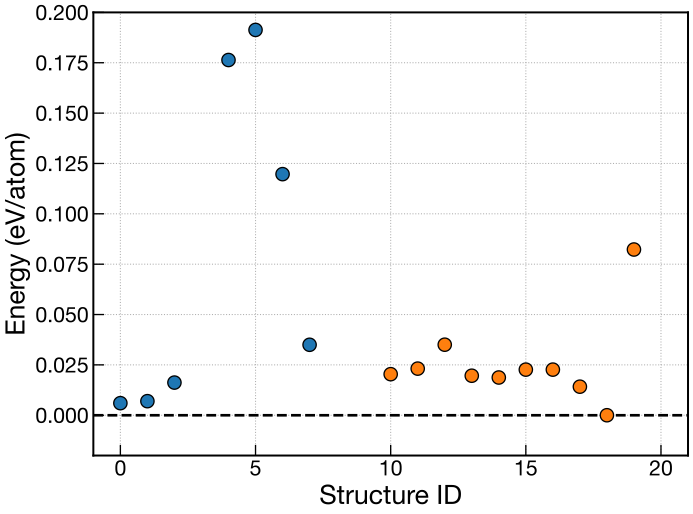
In this case, CrySPY overwrites ./data/energy_plot/energy_EA_gen_{gen}.{fig_fotmat}.
You can specify the range of generations to be plotted using plot_min_gen and plot_max_gen.
When plot_min_gen is set to specify a range (even if its value is 1), the output is saved with a different filename such as ./data/energy_plot/energy_EA_gen_{plot_min_gen}-{plot_max_gen}.{fig_fotmat}, instead of the usual one.
For example, to extract only the results of the second generation from the results available at generation 2:
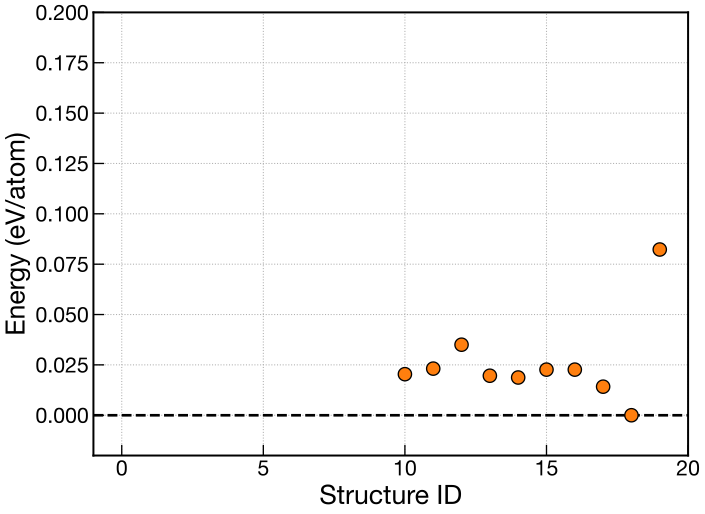
To change which generation the plot goes up to (i.e., the maximum value of the x-axis), specify the generation with ref_gen.
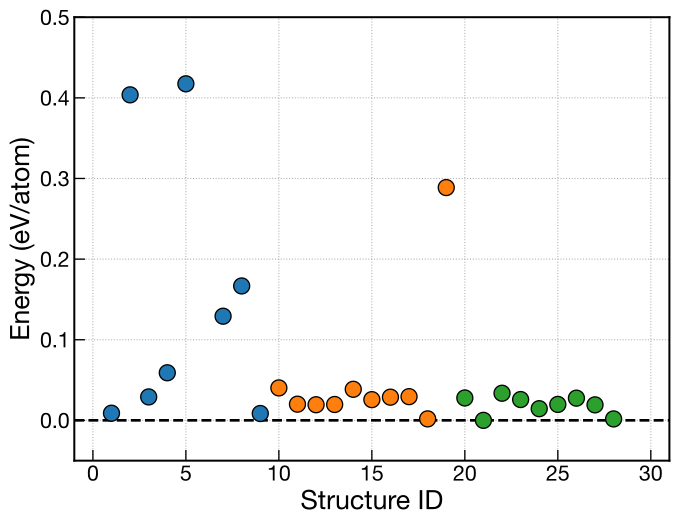
For example, as shown in the image at the top of this page, if three generations have been completed and you want to extract only the results from the second generation, set the [visual] section in cryspy.in as follows:
If ref_gen is specified, the output filename becomes
energy_EA_gen_{plot_min_gen}-{plot_max_gen}_ref_{ref_gen}.{fig_format}.
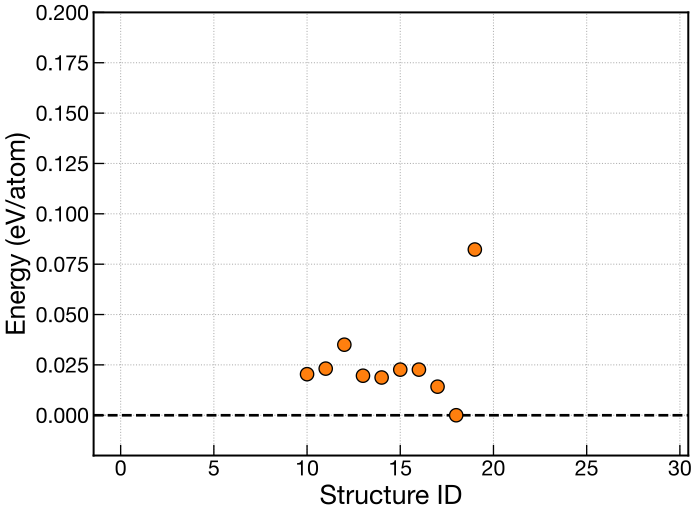
For more advanced data analysis or figure customization, download the files and use Jupyter Notebook as shown below.
Download Data
It is assumed here that you analyze and visualize CrySPY data on your local PC.
If you use CrySPY on a supercomputer or workstation, download the data to your local machine.
You can delete the work and backup directories if they are not needed, as their file size can be very large.
Jupyter Notebook
Move to the data/ directory in the results you downloaded earlier.
Then, if the CrySPY utility has already been downloaded locally, copy cryspy_analyzer_EA.ipynb.
Alternatively, you can download it directly from GitHub (CrySPY_utility/notebook/).
Launch Jupyter (e.g., VS Code, Jupyter Lab, or Jupyter Notebook),
and simply run the cells in order to obtain a figure like the one shown below.